How I Cut Our Multi-Cloud Bill by 46%: A $$/Month Infrastructure Post-Mortem
Our app had crossed 100,000 downloads on the Play Store. The mobile experience was fast, users were happy, ratings were solid. Then I looked at the cloud bill.
$680/month. For an app with ~1,200 daily active users.
That's not "slightly high." That's "something is fundamentally broken." So I spent two full days doing what every engineering team should do but rarely does: a rigorous, screenshot-verified, line-by-line cost audit across three cloud providers simultaneously.
This is that audit. The root causes were counterintuitive. The savings were significant — 46% of the total monthly bill recoverable with less than two weeks of work.
No guesses. No estimates. Every figure comes from billing consoles, exported logs, and query profilers.
Table of Contents
- The Architecture Under Audit
- The Numbers: What We Were Paying
- The Bot Army Nobody Noticed
- AWS Deep Dive: The CloudFront Billing Trap
- GCP Deep Dive: 80% of Cloud Run Was Idle
- MongoDB Atlas: The Smoking Gun Query
- The Full Bot Attack Chain
- Root Cause Attribution Table
- The Fix Matrix: 7 Optimizations, Prioritized
- What 46% Actually Looks Like
- Lessons for Every Multi-Cloud Team
1. The Architecture Under Audit
The product is a consumer parenting SaaS — mobile-first, with a companion website. The infrastructure spans three cloud providers, a choice made incrementally as features were added rather than from a single architectural decision.
| Layer | Technology | Monthly Cost |
|---|---|---|
| Website + CDN | AWS Amplify + CloudFront | ~$82 |
| Bot Defense | AWS WAF (8 rules) | ~$58 |
| API Routing + S3 + misc | AWS | ~$100 |
| Backend Services | GCP Cloud Run (11 services) | ~$182 |
| CMS + Infra | GCP Cloud SQL + Registry + misc | ~$94 |
| Primary Database | MongoDB Atlas M10 | ~$164 |
| Grand Total | All providers combined | ~$680/month |
For 1,200 DAU, $680/month felt wrong. The app was working fine. So where was the money going?
2. The Numbers: What We Were Paying
I pulled confirmed billing data for April — the most complete month on record.
AWS (Confirmed from Cost Explorer)
| Service | April |
|---|---|
| WAF | $58.00 |
| Amplify | $82.40 |
| Tax | $21.50 |
| S3 | $30.20 |
| CloudWatch | $8.40 |
| Route 53 | $3.50 |
| API Gateway | $18.20 |
| Secrets Manager | $2.50 |
| Others | $15.30 |
| Total AWS | $240.00 |
GCP
| Service | Monthly |
|---|---|
| Cloud Run (all prod) | $182.00 |
| Cloud SQL (Strapi) | $48.00 |
| Artifact Registry | $28.00 |
| Logging + Scheduler + Storage | $18.50 |
| Total GCP | $276.50 |
MongoDB Atlas
| Month | Total |
|---|---|
| December 2025 | $178.40 |
| January 2026 | $182.20 |
| February 2026 | $156.80 |
| March 2026 | $168.40 |
| April 2026 | $164.20 |
Combined April total: ~$680/month
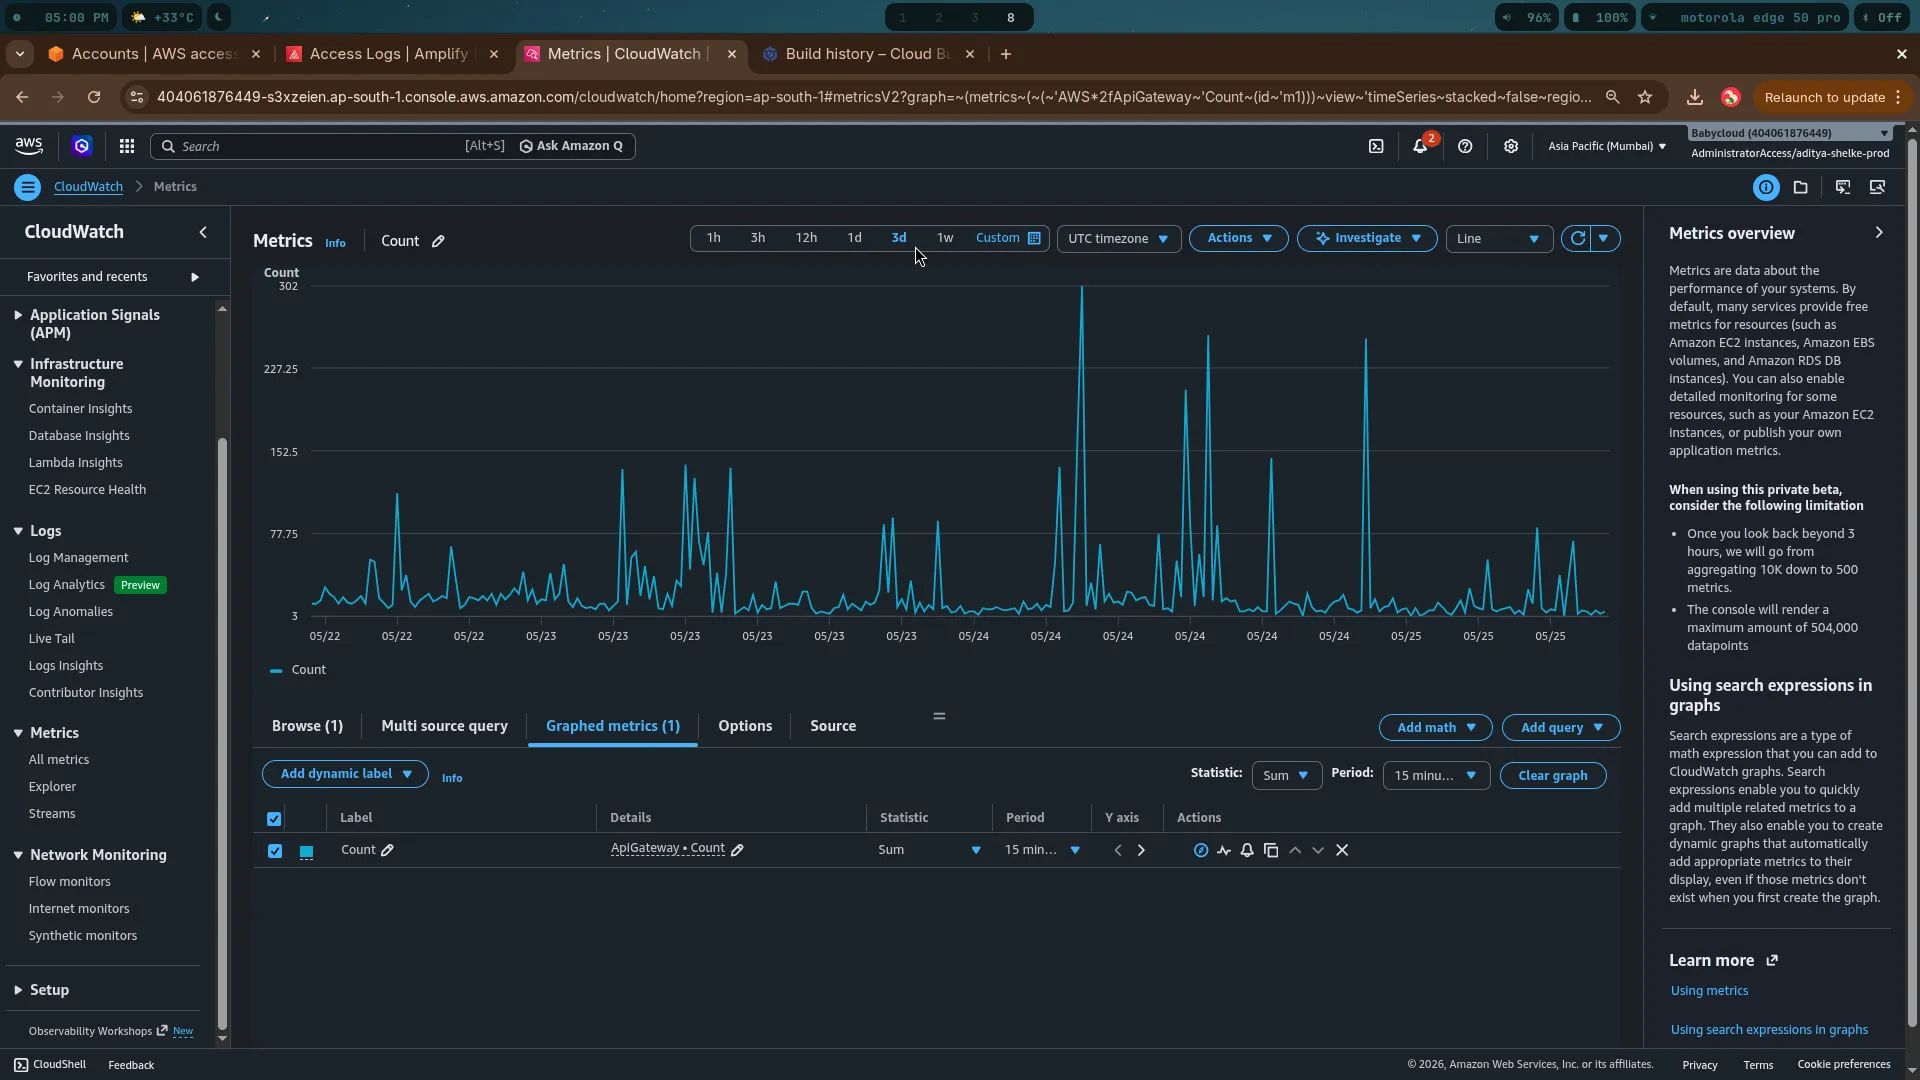
The WAF bill immediately stood out. $58/month for a WAF on a parenting app? That implied tens of millions of evaluated requests. We needed to understand what was driving that volume.
3. The Bot Army Nobody Noticed
I exported Amplify access logs for 7 days. The results were startling.
203,840 total requests across 7 days. 199,050 of them returned 403 — blocked by the WAF.
That's a 97.6% block rate. The WAF was doing its job. But the volume told a different story entirely.
What the Bots Were Targeting
| Path | Requests | % of Total |
|---|---|---|
| Baby name detail pages | 176,930 | 86.8% |
| Baby name similar pages | 20,380 | 10.0% |
Static assets (/_next/) |
2,446 | 1.2% |
| Blog pages | 407 | 0.2% |
| Other | 3,677 | 1.8% |
96.8% of all traffic was bots targeting baby name pages. Blog pages — which use Strapi and Cloud SQL — were almost completely ignored. This single finding immediately ruled out Cloud SQL as a bot-driven cost.
The Botnet Profile
The botnet uses globally distributed cloud hosting — US, Singapore, Europe — all blocked by a geo-block WAF rule. But ~2.4% slipped through: Googlebot (intentionally allowed) and Indian-IP bots using domestic carrier IP ranges to bypass the geo-block.
Every request in that 2.4% triggered the full stack: Amplify SSR → API Gateway → Cloud Run → MongoDB.
4. AWS Deep Dive: The CloudFront Billing Trap
This is the most important finding in the entire audit — and the one most engineers get wrong.
The WAF blocks 97.6% of requests. So why is the Amplify bill still $82.40?
The answer: CloudFront charges for every HTTPS request — including the ones WAF blocks with a 403.
Bot Request
    │
    ▼
CloudFront Edge ← billed here ($0.0090 per 10,000 requests)
    │
    ▼
WAF evaluation ← billed here ($1/rule/month + $0.60 per 1M requests)
    │
    ▼ (403 BLOCK — Amplify never invoked)
Response to bot
Amplify's SSR Lambda is never invoked for blocked requests. But CloudFront still charges for every single HTTPS connection. I reverse-computed the actual volume from the WAF bill:
April WAF bill: $58.00
Fixed cost:     $5.00 (ACL) + 8 rules × $1.00 = $13.00
Variable cost:  $58.00 − $13.00 = $45.00

Requests evaluated: $45.00 ÷ $0.60 × 1,000,000 = 75,000,000
75 million WAF evaluations in April. At the CloudFront HTTPS rate of $0.0090 per 10,000:
75,000,000 × ($0.0090 / 10,000) = $67.50 in CloudFront request feesThat $67.50 appears under the Amplify line item — not a separate CloudFront line — because Amplify hosting bundles the CloudFront distribution. This is why the Amplify bill looks inflated even though the WAF is working perfectly.
The Amplify Bill, Broken Down
| Component | Cost | Driver |
|---|---|---|
| CloudFront fees (75M bot requests) | ~$67.50 | Bot traffic |
| CloudFront fees (passing requests) | ~$2.10 | Googlebot + real users |
| SSR Lambda compute (passing only) | ~$6.40 | Googlebot + real users |
| Build minutes | ~$3.50 | Fixed |
| Misc | ~$2.90 | Fixed |
| Total Amplify | $82.40 | ✓ confirmed |
Without bots, the Amplify bill would be ~$14.90/month. Bot-attributable: $67.50/month.
The API Gateway History Lesson
The history shows exactly what happened before the geo-block WAF rule was deployed:
| Month | API Gateway Cost | Event |
|---|---|---|
| November 2025 | $420.80 | Pre-WAF, full bot exposure |
| December 2025 | $218.40 | Partial mitigation |
| January 2026 | $38.20 | ← Geo-block WAF rule deployed |
| February 2026 | $14.80 | Stabilizing |
| April 2026 | $18.20 | Steady state (real users + leakage) |
A 95.7% reduction in API Gateway costs after the geo-block rule went live.
5. GCP Deep Dive: 80% of Cloud Run Was Idle
Here's the counterintuitive finding: the GCP bill is almost entirely NOT caused by the bots.
The Cloud Run SKU breakdown for April told the real story:
$146.90/month was paid for containers that served zero requests.
The Zombie Service Roster
The prod project had 11 Cloud Run services. Only one had any traffic:
| Service | Last Deployed | Req/sec | Status |
|---|---|---|---|
| care-service-prod | Recent | 0.08 | ✅ Active |
| auth-service-prod | Apr 2026 | 0 | 🟡 Standby — needed |
| content-service-prod | May 2026 | 0 | 🟡 Standby — needed |
| community-service-prod | Nov 2025 | 0 | 🟡 Standby — needed |
| compare-service-prod | Oct 2025 | 0 | 🟡 Standby — needed |
| ae-content-service | Jan 2025 | 0 | 🔴 Zombie — 18 months idle |
| langserve-prod | Feb 2025 | 0 | 🔴 Zombie — 15 months idle |
| langserve-service-prod | Jul 2025 | 0 | 🔴 Zombie — 10 months idle |
| strapi-prod-cms-v2 | Jan 2025 | 0 | 🔴 Superseded, never deleted |
| analysis-service-prod | Jul 2025 | 0 | 🔴 Zombie — 10 months idle |
The active care-service-prod was correctly configured at min-instances: 0. The entire idle billing came from the other services still set to min-instances > 0. You pay for min-instance CPU and memory 24/7 regardless of whether a single request arrives.
Why GCP Bot Cost Is Effectively Zero
The 2.4% of bots that slipped the WAF generated roughly 7,500 baby name page loads per month at the origin. At 1.5s average Cloud Run execution:
7,500 requests × 1.5 vCPU-seconds = 11,250 vCPU-seconds/month

GCP Free Tier: 180,000 vCPU-seconds/month
Used: 6.25% of free tier

Cloud Run bot cost = $0.00
The bots were almost entirely an AWS problem. GCP's problem was infrastructure waste.
6. MongoDB Atlas: The Smoking Gun Query
MongoDB Atlas M10 was $164/month. I pulled the Query Profiler for a 24-hour window:
| Namespace | Operation | Count/day | Avg Latency | Total Time/day |
|---|---|---|---|---|
| contentDB.baby_names | aggregate | 1,824 | 1.23 seconds | 37.4 minutes |
| ims.zoom_webhook_events | find | 147 | 12 ms | 1.76 min |
| contentDB.activities | read | 98 | 640 ms | 1.05 min |
| ims.doneTest | read | 126 | 193 ms | 24.3 sec |
| ims.loyaltyPoints | read | 38 | 636 ms | 24.2 sec |
The baby names aggregation consumed 37.4 minutes of Atlas compute per day — roughly 35x more than any other collection.
Why the Query Takes 1.23 Seconds
The pipeline runs an Atlas Search (Lucene-based) faceted aggregation — computing facets by gender, name origin, and first letter in a single pass. The Docs Examined: 0 in the profiler confirms it's correctly using Atlas Search (not a collection scan), but the facet computation across the full index is expensive at scale.
// The expensive shape — full faceted search
{ pipeline: [
    { $search: { index: "baby_names_search", compound: {...} } },
    { $limit: 20 },
    { $facet: { byGender: [...], byOrigin: [...], byLetter: [...] } }
]}
// Count: 1,712/day | Avg: 1.25s | Total: 35.7 min/day
The Cruel Irony of MongoDB Billing
Despite the query being the top Atlas compute driver, fixing it saves almost nothing on the bill:
Bot-driven baby name queries: ~52,000/month
Data returned per query: ~5 KB
Total bot-driven data transfer: ~254 MB/month

Atlas transfer rate: $0.09/GB
Bot-attributable MongoDB cost: $0.02/month
The M10 base cost (~$57/month for compute, which is a publicly fixed tier price) is the dominant line item — you pay it whether you run 1 query or 1 million. The only path to meaningfully reducing the MongoDB bill is downgrading the cluster tier. But with data usage approaching the M10 ceiling, and an M5 capping at half that capacity, a downgrade requires a data cleanup campaign first.
Performance Advisor: 13 Index Issues Found
Atlas Performance Advisor flagged 13 index problems:
- 6 missing indexes — one collection had a 659:1 docs-scanned-to-returned ratio; another had 3,291:1
- 7 unused indexes — consuming write overhead and storage with zero query benefit
These won't reduce the bill directly, but fixing them drops latency by 80-90% on several hot endpoints.
7. The Full Bot Attack Chain
With all three providers analyzed, the complete per-request cost chain becomes clear:
8. Root Cause Attribution Table
| Cost Driver | Provider | Monthly Cost | Root Cause | Bot-Driven? |
|---|---|---|---|---|
| WAF evaluation fees | AWS | $58.00 | 75M bot requests × 8 rules | ✅ Yes |
| CloudFront request fees | AWS | ~$67.50 | 75M bot requests at edge | ✅ Yes |
| Idle min-instance billing | GCP | $146.90 | 10 services min>0, zero traffic | ❌ Infrastructure waste |
| Atlas M10 base cost | MongoDB | ~$57.00 | Fixed tier, data approaching ceiling | ❌ Over-provisioned |
| Cloud SQL (Strapi) | GCP | $48.00 | Operational CMS cost | ❌ Fixed |
| Artifact Registry | GCP | $28.00 | Stale image layers across 11 services | ❌ Cleanup needed |
The bot problem is almost entirely an AWS problem. GCP's waste is idle infrastructure. MongoDB's issue is data preventing downgrade.
9. The Fix Matrix: 7 Optimizations, Prioritized
OPT-1: Why Removing Website Pages Stops the Bot Bill
The bots are targeting the website — not the mobile app. Removing those pages means:
- Bots get 404s instantly from CDN cache — no WAF evaluation occurs
- WAF request volume drops from 75M/month to ~250K (Googlebot + real users)
- WAF bill: $58 → ~$12 (simplified ACL with fewer rules needed)
- Amplify bill: $82.40 → ~$14.90
The feature remains fully functional inside the mobile app. Nothing is deleted from the database.
OPT-2: One YAML Change, $100+ Saved
# Before — causes idle billing at $88.10/mo CPU + $58.80/mo memory:
--min-instances=1

# After — scales to zero, zero idle charge:
--min-instances=0
The active care-service was already at min: 0 and working correctly. Cold starts add 2–5 seconds on the first request after an idle period. For a mobile-first app, this is completely acceptable.
10. What 46% Actually Looks Like
| Scenario | Monthly | Annual |
|---|---|---|
| Current | $680 | $8,160 |
| After OPT 1–5 | $367 | $4,404 |
| After OPT 1–7 | $322 | $3,864 |
| Best-case saving | $358/mo | $4,296/yr |
11. Lessons for Every Multi-Cloud Team
1. CloudFront bills for blocked requests — always
If your WAF is attached to a CloudFront distribution, you're paying the HTTPS request fee for every bot that connects — even 403s. The metering clock starts at the edge, before the WAF decision. A geo-block rule doesn't reduce your CloudFront bill. Only reducing the number of bots that attempt requests in the first place does.
2. min-instances > 0 is a silent subscription
Any Cloud Run service with min-instances > 0 is a monthly line item you're paying regardless of traffic. Easy to set during deployment ("I don't want cold starts in prod") and easy to forget. Audit all services quarterly — if zero req/sec for 30 days, set to 0 or delete.
3. Zombie deployments accumulate silently
We found services last deployed 18 months ago still billing. Artifact Registry was storing Docker image layers for every push to 11 services, most of which hadn't changed in a year. A monthly dead-service sweep catches this before it compounds.
4. Bot cost attribution is asymmetric across providers
The most important insight from this audit:
- AWS: ~70% of the bill was bot-driven (CloudFront + WAF)
- GCP: 80% of the Cloud Run bill was idle infrastructure — nothing to do with bots
- MongoDB: Nearly 100% of the bill was the fixed tier base; bot queries cost $0.02
If you look at a $680 total and try to solve the "bot problem" by optimizing MongoDB or Cloud Run, you'll save almost nothing. The correct intervention requires knowing which provider is generating cost and why.
5. The WAF is a cost center, not just a security tool
Every WAF rule costs $1/month plus proportional request fees. An 8-rule ACL costs $13/month before a single request arrives. The WAF evaluates requests before blocking — meaning the billing clock runs even on requests it immediately rejects.
Keep rule sets minimal. Every rule needs to earn its place. Consider whether a CDN-level rate limit can replace multiple WAF rules at lower total cost.
6. Your Atlas tier must fit your data volume
MongoDB M10 vs M5 is a ~$27/month difference on a publicly fixed tier pricing model. The only thing blocking a downgrade is disk capacity — data accumulated from multiple products sharing a cluster. Audit your Atlas disk usage the same week you provision a new cluster, and enforce a data retention policy before you hit the ceiling.
Closing Thoughts
Multi-cloud cost optimization isn't about finding one big thing. It's about systematic attribution — tracing every cost line back to its actual cause, not the intuitive one.
- The bots looked like a GCP + MongoDB problem. They were almost entirely an AWS CloudFront problem.
- GCP looked expensive because of bots. It was expensive because of zombie containers.
- MongoDB looked like it needed query optimization. It needed disk cleanup to allow a tier downgrade.
The methodology was simple: export billing CSVs, export access logs, pull the query profiler, compute from first principles. No specialized cost management SaaS. Just billing consoles and focused attention.
ROI: $313/month saved for roughly 10 engineering days of implementation work.